Recent Coachella Valley Real Estate Market Trends

Paul Kaplan
I've made it a professional goal to be known as a leader in the real estate industry in the Palm Springs market for the past 25+ years...
I've made it a professional goal to be known as a leader in the real estate industry in the Palm Springs market for the past 25+ years...
Dive into the Palm Springs & Coachella Valley real estate market’s latest direction with our August 2022 recap. We have been highlighting a shift across the summer months, with many of these trends carrying into the most recent full month of data. Continue reading to see where the market is heading and what it means as the desert enters cooler months, and a traditionally hotter time for real estate. Keep in mind the data and analysis in the recap is comprehensive of the entire desert resort region. Want to learn more about the current state of the market in a specific city, community, or neighborhood? Please contact your local Paul Kaplan Group REALTOR®. We will unlock possibilities for you.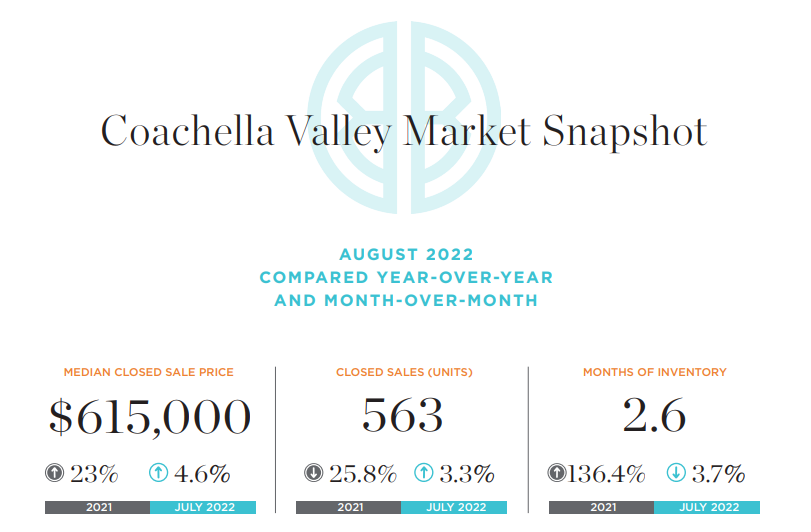.png)
.png)
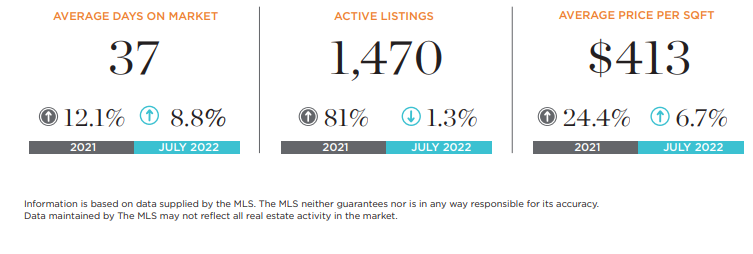
Many market patterns from the previous summer months carried over into August of this year, but with some variation. The number of new listings hitting the market dropped, while the number of closed sales and properties going into pending status increased, indicating that the August recap could have a robust sales figure as those transactions close. With the number of active listings edging down, the median sold price once again increased, as did the average price per square foot. The sale pace, noted as days on market, slowed by a fair margin. The listing discount (sold price versus list price presented as a percentage) continued its steady decline, ending at a 2% discount. Due to the slowing sale pace coupled with the decrease in new listings, the months of inventory finished slightly lower than the previous month but remains above 2.5 months.
As the final full month of summer, traditionally a slower time of the year for home sales, August’s trends and overall numbers could be a sign of things to come heading into the height of the desert’s prime season when we typically see inventory rise along with sales activity. The number of homes for sale at the end of the month was 81% higher when compared annually. The status of this key metric indicates that the extreme nature of the pandemic-era market, which was fueled by limited inventory, is mostly behind us. As more homes go up for sale and buyers enjoy additional choices, we expect the listing discount to continue its current course and return to a more normal level of about 3-5% off the list price. These factors will also allow home price gains to flatten to typical figures in the low-to-mid single digits. Regardless of your interest in buying or selling property, now is an ideal time to make your move before more competition enters the market, whether that be homes coming to market, or buyers in the buyer pool.
August saw 563 homes exchange owners, a 25.8% drop from the same time last year but a 3.3% increase month-over-month. Those transactions created over $490 million in sales volume, a 3.3% increase year-over-year but a 6.8% drop month-over-month. A total of 797 new listings hit the market in August, a 16% decline from the same month last year and a 10.9% drop from July of this year. The month saw 736 homes go into pending status, a 2.1% drop from August 2021, but a 31.9% leap over July 2022. The median sale price of a home finished the month at $615,000, a 23% increase year-over-year and a 4.6% increase month-over-month. Likewise, the price per square foot of a sold home came in at $413, a 24.4% jump annually and a 6.7% increase over the prior month. The sale pace, noted as average days on market to sell a home, clocked in at 37 days, a 12.1% increase (slower) year-over-year and an 8.8% increase month-over-month. Additionally, the listing discount, calculated by dividing the final sale price by the list price, ended the month at 98%, representing a 2% discount, a 3% decline from the same month last year and a 1% drop from July of this year. The market closed out the month with 1,470 homes for sale, an 81% surge year-over-year and a slight 1.3% dip from the previous month. Overall, there are 2.6 months of inventory on the market to feed demand, a 136.4% increase year-over-year and a 3.7% decline from the prior month. A balanced market is considered around 6 months of inventory. Although buyers are gaining more leverage in negotiations, inventory is still scarce enough to give sellers a slight advantage.
If you are considering your options for the sale or purchase of a property in the Coachella Valley, we would be honored to have the opportunity to be part of your process. Please reach out to a Paul Kaplan Group REALTOR® for a free market analysis of your current property or to discuss the lifestyle you seek in your next home. Visit PaulKaplanHomes.com to get started.
.
Selling Your Home?
Get your home's value - our custom reports include accurate and up to date information.