Palm Springs Real Estate Market Activity

Paul Kaplan
I've made it a professional goal to be known as a leader in the real estate industry in the Palm Springs market for the past 25+ years...
I've made it a professional goal to be known as a leader in the real estate industry in the Palm Springs market for the past 25+ years...
June 2, 2024 - Paul Kaplan Group, Inc.
If you're keeping an eye on the real estate market in Palm Springs and some of its neighboring cities, The Paul Kaplan Group has you covered. We've compiled some fascinating data on market activity over the last 30 days, highlighting important trends and insights. Whether you're a potential buyer, a seller, or just curious about the Palm Springs real estate market, this detailed overview will provide you with valuable information. Let's dive in!
Average Home List Price by City
First, let's look at the average home list prices across various cities:
- La Quinta: $971,237
- Palm Desert: $615,776
- Cathedral City: $353,646
- Palm Springs: $848,291
- Rancho Mirage: $1,015,248
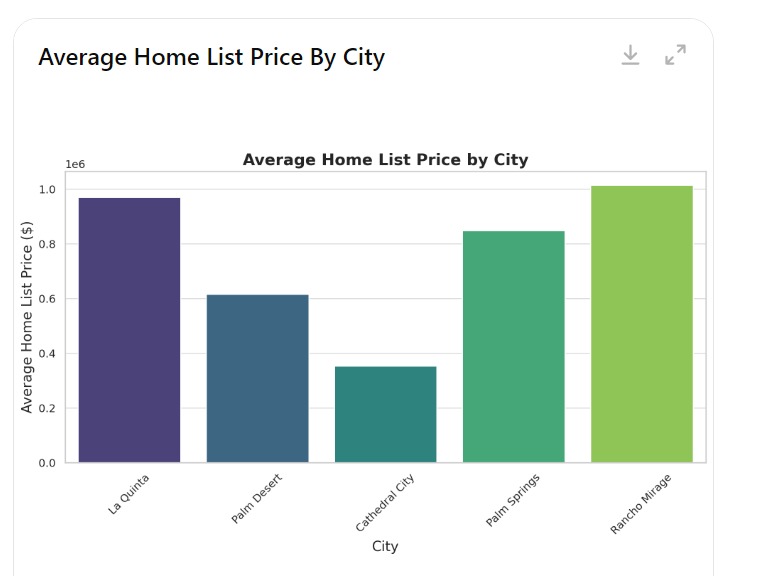 Rancho Mirage tops the list with the highest average home list price, while Cathedral City offers more budget-friendly options.
Decrease/Increase from 1 Year Ago
Next, we have the percentage change in average home list prices compared to one year ago:
- La Quinta: +0.10%
- Palm Desert: -2.40%
- Cathedral City: -2.30%
- Palm Springs: +0.80%
- Rancho Mirage: +0.70%
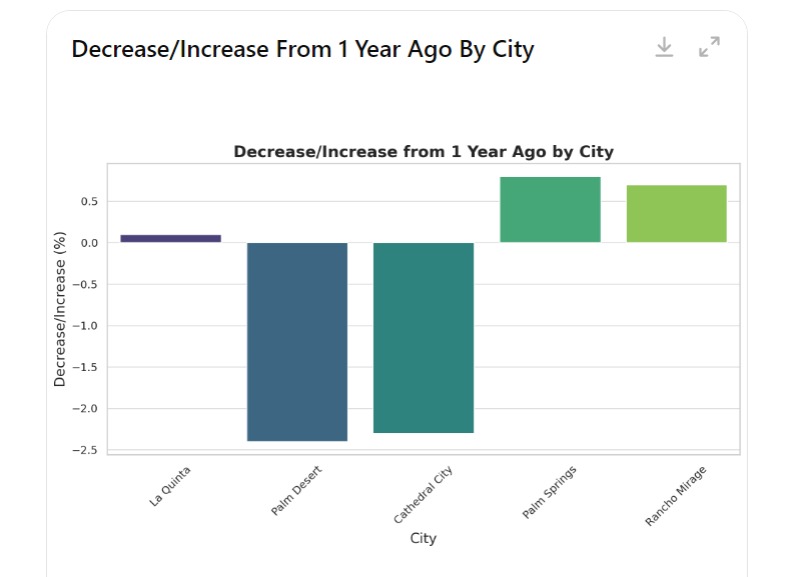 Palm Springs and Rancho Mirage have seen modest increases, while Palm Desert and Cathedral City experienced slight decreases.
New Listings by City
The number of new listings in the last 30 days is a crucial indicator of market activity:
- La Quinta: 236 new listings
- Palm Desert: 357 new listings
- Cathedral City: 148 new listings
- Palm Springs: 358 new listings
- Rancho Mirage: 129 new listings
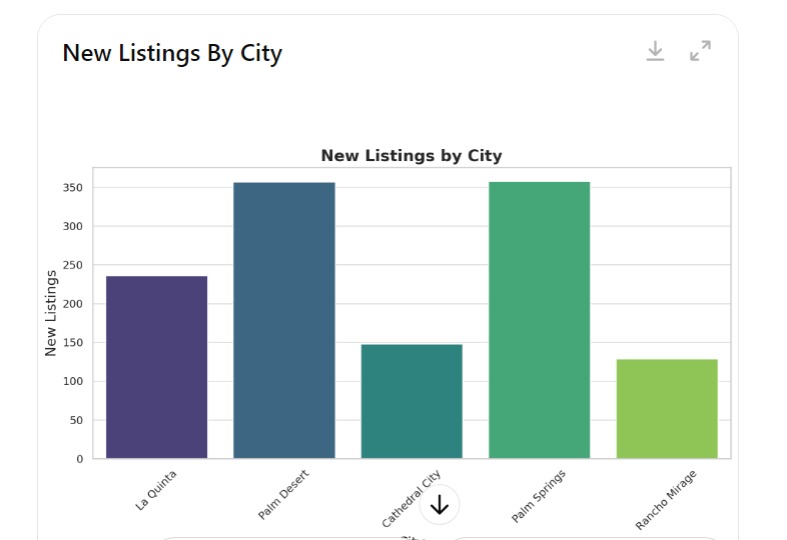 Palm Springs and Palm Desert lead with the highest number of new listings, signaling robust activity in these areas.
Sold Listings by City
The number of properties sold in the last 30 days reflects buyer interest and market movement:
- La Quinta: 137 sold listings
- Palm Desert: 186 sold listings
- Cathedral City: 78 sold listings
- Palm Springs: 176 sold listings
- Rancho Mirage: 56 sold listings
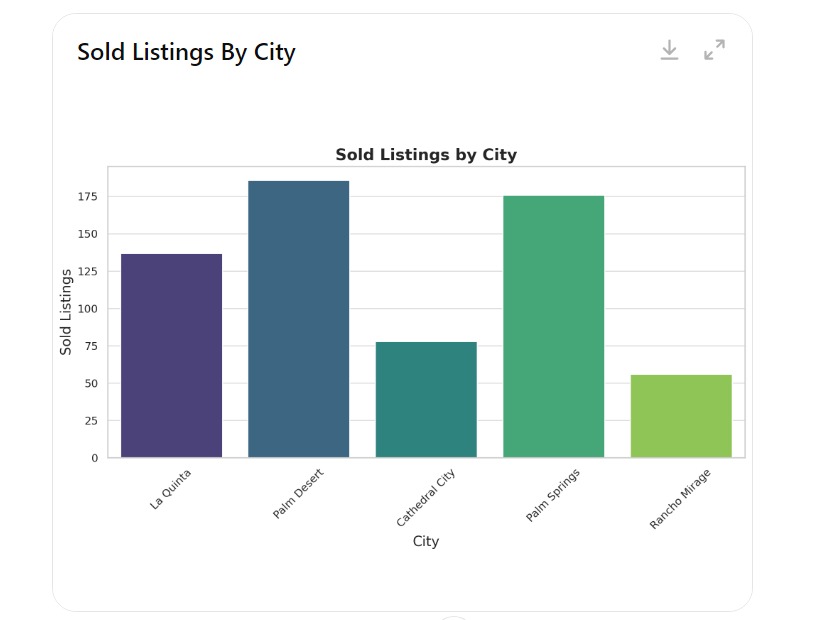 Palm Desert shows the highest number of sold listings, followed closely by Palm Springs, indicating strong buyer activity.
Average Days on Market by City
Finally, the average days a property stays on the market can tell us a lot about market dynamics:
- La Quinta: 173 days
- Palm Desert: 160 days
- Cathedral City: 142 days
- Palm Springs: 111 days
- Rancho Mirage: 172 days
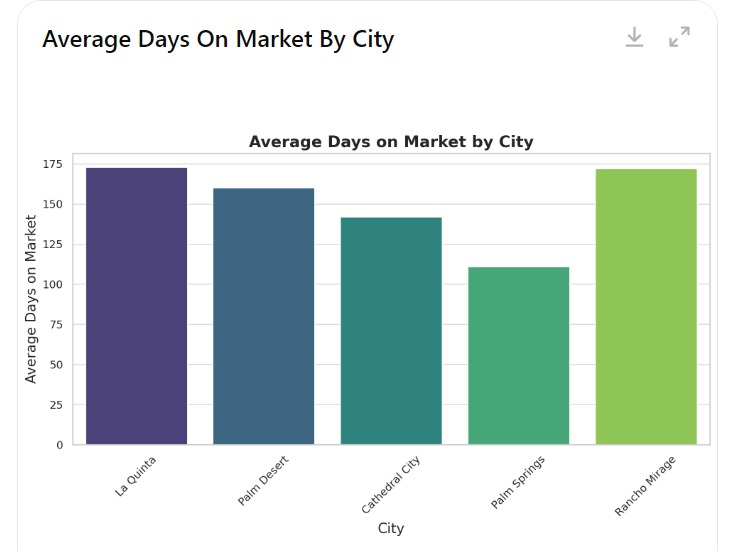 Palm Springs stands out with the shortest average days on market, suggesting a faster turnover compared to other cities.
Conclusion
The Palm Springs real estate market continues to show dynamic activity, with varied trends across different cities. Whether you're looking to buy, sell, or just stay informed, understanding these market patterns can help you make better decisions.
If you have any questions or need more detailed information, feel free to reach out to us. We're here to help you navigate the Palm Springs real estate market with confidence!
Stay tuned for more updates and insights. Happy house hunting! We're here to help with your all your real estate services; feel free to contact us at www.PaulKaplanHomes.com.
*Info provided by The MLS
Selling Your Home?
Get your home's value - our custom reports include accurate and up to date information.